Critical services running on infrastructure you do not own?
Describe your setup in a 30-minute technical call and we will tell you what can be integrated, what cannot, and where we would start.
Critical services delivered by external providers live in their dashboards, not yours. We install sensors that independently measure the real user experience, and bring the data — theirs and yours — into your internal systems: a unified dashboard, consolidated history, alerting and SLA reports.
30 minutes, no obligations — just engineering answers.
Every external provider comes with its own portal. To answer "did the service work today?" you open three interfaces and compare by hand.
Notifications stay in the provider tool or land in a generic inbox. They do not enter ticketing, do not reach the on-call team and trigger no internal flow.
The provider reports its own availability figures. You have no independent measurement to hold against them at contract review.
Portals keep a few weeks of data. Year-long trend analysis, or correlating an incident with the rest of the stack, simply is not possible.
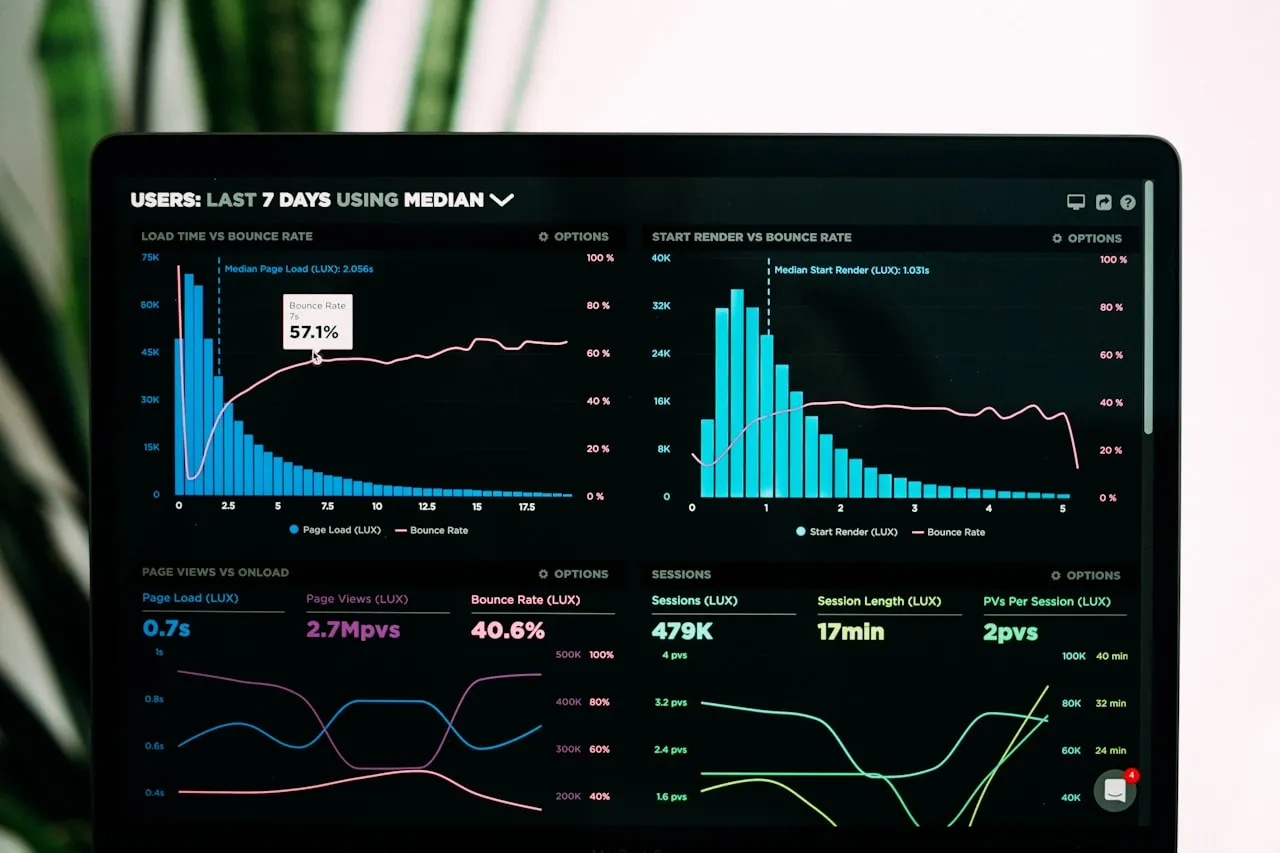
We pull data from the tools you already run and from provider portals, over REST API or scheduled export. We replace nothing that already works.
We bring metrics with different formats and frequencies to a common model with a unified timestamp, and keep them as long as your retention policy requires — not as long as the provider portal allows.
One view of availability, by zone and by service, plus compliance reports generated from independently measured data and exportable for contract reviews.
Alerts go where the team already works: email, your ticketing system, or a webhook to anything else. With thresholds and routing you define.
We install and operate HPE Aruba UXI sensors at clients, in production. The sensor sits on site — a meeting room, an office area, a branch — and simulates what a real user does: connects wired or wireless, reaches the Internet, Teams and Microsoft 365, checks internal applications, DNS and DHCP, then reports what worked and what did not.
The result is a measurement independent of the provider: you learn the service is degraded before someone calls you, even when the infrastructure is not yours. Sensor data lands in the same consolidation layer as every other source — unified dashboard, history, alerting and SLA reports.
We inventory which tools and portals exist, what each exposes (API, export, webhook) and what data is missing. The output is a source map and a list of what can realistically be integrated.
We pick one source and take it end to end: connector, normalisation, a working dashboard. You verify on real data before committing budget for the rest.
We add the remaining sources on the model validated in the PoC, together with alerting and SLA reports.
We hand over the code, the operations documentation and the procedure for adding a new source. You continue with your team or with us — your call.
We build the integration layer in Laravel and Vue 3, with PostgreSQL for historical metric storage. Deployment on-prem or in a private cloud, depending on where the data is allowed to live.
We connect to any source that exposes a REST API or a scheduled export. If a provider only offers a portal, we check during the audit what can be extracted and tell you plainly if it cannot.
We build software for companies, not consumers. Integrating with existing systems and their constraints is our day-to-day work.
Quality management and information security, both certified — relevant when the integration layer touches operational data.
We have delivered in banking and the public sector, where access procedures, traceability and network separation are not optional.
When data cannot leave the organisation, we run entirely inside your infrastructure, with no dependency on an external service.
No. We work on top of them. Your tools stay the source of truth for what they already measure; we pull the data out and bring it together with the rest. If a tool covers an area well, there is no reason to change it.
Both. We install and operate HPE Aruba UXI sensors at clients, in production, where an independent measurement of the real connectivity experience is needed. If you already run sensors or other monitoring tools, we connect to them and stay on the consolidation layer only.
Typically 2–4 weeks for a single source, depending on how accessible the data is. The source audit that precedes it usually takes under a week.
No. By default we run inside your infrastructure — on-prem or in your private cloud — and the data never leaves the organisation. If you prefer hosting with us, that can be discussed separately.
Any source that exposes a REST API or a scheduled export (CSV, JSON, syslog). We do not promise integrations with products we have not tested — we check each source during the audit and tell you before quoting what is possible and what is not.
The source audit and the PoC are quoted separately, as fixed-scope packages. The rollout is estimated after the PoC, once the number of sources and their accessibility are known. We do not quote the whole project before seeing the data.
Describe your setup in a 30-minute technical call and we will tell you what can be integrated, what cannot, and where we would start.
Trusted by founders, scale-ups & enterprise teams